
Marine Planning Portal User Guide
Table of Contents
1. Overview
When opened for the first time, the Marine Planning Portal should look similar to the figure below.
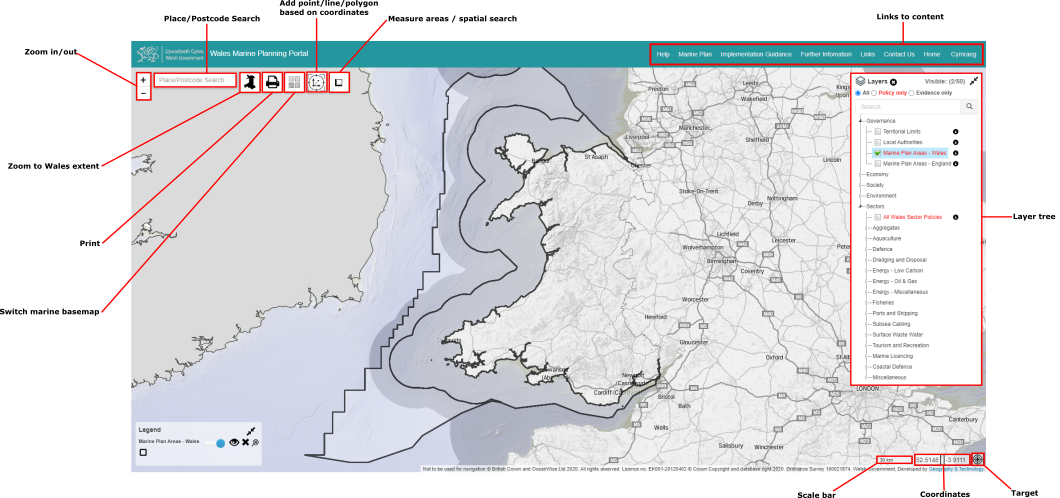
The main elements of the user interface are detailed here:
- Zoom in/out: Controls to zoom in and out of map;
- Place/Postcode Search: Search for locations by postcode, place names, or marine features;
- Zoom to Wales extent: View the full extent of Wales on the map;
- Print: Print the current map view;
- An option to change the base mapping;
- Add point/line/polygon based on coordinates;
- Measure Areas / Spatial Search;
- A scale bar;
- The current coordinates of the map centre (editable);
- A target to focus on the map centre;
- The Layer Tree, where you can add additional mapping content;
- Links to this Help Page and other content about Marine Planning and evidence.
How each of these items can be used is detailed below.
2. Navigating around the map
Navigating around the map is intuitive (much like Google Maps):
- Your default icon on the screen is a hand
 , (an Arrow in Internet Explorer) and by clicking and holding anywhere on the map you can "Grab and pan"
  , dragging the map across the screen.
 - You can use the "scroll dial" on your mouse to zoom in and out;
- If you hold down the shift key, and clicking on the map, you will be able to draw a rectangle, to zoom into a particular area of the map;
There are also a few extra tools:
- The Plus/ Minus tool
 allows you to zoom in and out by a set amount;
 - Clicking on the Wales Icon
 takes you back to an All Wales view;
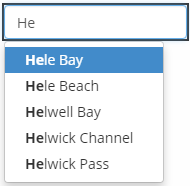
Searching
If you start typing a place name e.g. Helwick Channel in the Search box you will see a list appear of locations from which you may make a selection. You can search by postcode, location or marine feature. The map will then be positioned with your selection at the centre of the map.
Additional Tools
In the bottom right hand corner, there are some more tools:
- There is a scalebar
 to show the extent of the mapping window;
 - You are able to enter Longitude and Latitude coordinates
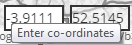 to centre the map to that location ;
 - The Target icon
 brings up a set of crosshairs on the centre of the screen, and after moving the map screen the new central coordinates will be displayed in the Longitude/ Latitude boxes, to assist in the location of objects.
3. Adding Map Layers
When you first open the portal, only the base mapping is displayed, and no additional layers have been made visible.
A maximum of 50 layers can be displayed at any one time.
The number of open visible layers is displayed at the top of the Layer Tree.
All of the visible layers can be removed by clicking on the  button.
By default the Layer Tree is semi-transparent, so that you can see the mapping beneath.
When the mouse pointer is moved over the Layer Tree it becomes opaque, so that the content is more legible.
The whole of the layer tree can be minimised or maximised by clicking on these icons 

The Map layers have been grouped into various categories.
Each category contains separate data layers which represent those within the Policy Sectors or supporting Evidence relating to the Wales National Marine Plan.
It is possible to view All of the Data Layers, just those from the Policy Sectors, or the supporting Evidence, by clicking on the small buttons at the top of the Layer Tree.
Each of the data layers has been assigned as to whether it relates directly to Marine Policy, or whether it is supporting Evidence.
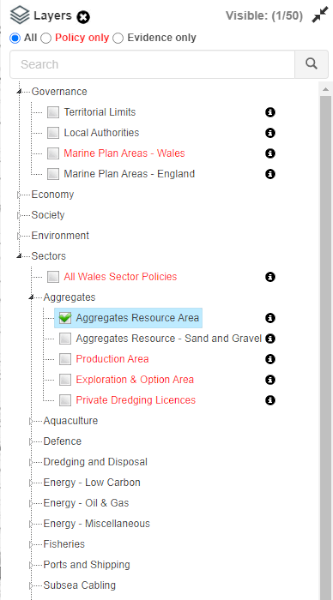
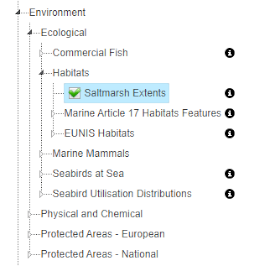
To expand a group to display the individual map layers available click on the group heading e.g. Environment > Ecological > Habitats.
If the arrow is just a black outline ![]() , then you can expand that group of layers.
, then you can expand that group of layers.
If the arrow is solid black ![]() , then no further expansion is available.
, then no further expansion is available.
Once you have expanded the group you can select the individual layer you wish to be displayed on the map. You may select multiple layers to be displayed at the same time, but be careful as the map can become overcrowded.
To remove a layer from the map uncheck the box beside the layer that you wish to remove.
To hide the layers in a group click on the heading again.
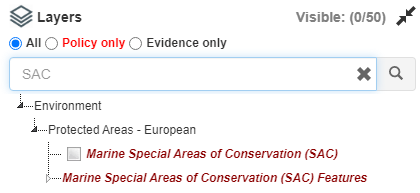
Searching for Data Layers
If you have an idea of the name or type of data you are looking for, e.g. SAC, you can enter a term into the search box
Once you have typed in your keyword, and pressed enter, any layer which has that term in its title will be listed below;
Each layer that has been found can be added to the map by clicking the boxes;
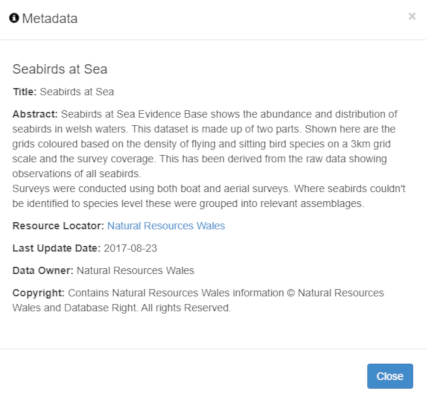
Data Layer iNotes
Against many of the data layers there is an additional "iNote" button  which provides additional information about each data layer (the metadata).
- A brief description of each layer;
- Who created and owns the data;
- When the data was created;
- The majority of the data on the Marine Planning Portal is not sourced from the Welsh Government, but from Third Parties
- It is recommended that you approach the data owner for information regarding availability, re-use and copyright of the dataset, and reporting of perceived errors in the data.
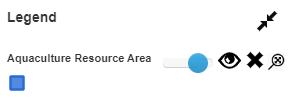
Legend
Once a data layer is activated a Legend pops up in the Lower Left hand area of the Map Window.
In this example the Aquaculture Resource Area layer is active and the colour classes of the data are displayed.
There will be an item for each of the active data layers in the legend.
Like the Layer Tree, it is possible to minimise the window by clicking on these icons
Alongside the Layer Heading there is a 'Slider' with a blue button, which controls the opacity of each and any active layers.
Clicking and Sliding the button from right to left reduces the opacity of the layer, enabling you to more easily see any data that might be stacked below.
The Eye icon enables you to switch the layer on and off, without actually closing it
The X enables you to remove the layer from the map window.
The  icon enables you to zoom to the full extent of the layer.
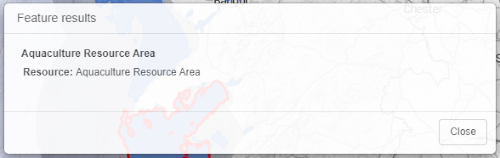
4. Displaying Data Specific Information
If you wish to display more detailed information about an area on the map, what the values of the dataset are, and any additional data, simply click (with the left mouse button) on the data point or polygon on the map and an Information dialogue will be displayed.
In this example you can see the description of the Aquaculture Resource Area dataset.
There is information about its Type, the Sector Policies it pertains to, and Sector Policy Information
It is possible to drag this information box about the screen, by clicking and holding on the top bar of the pop-up, so that you can view the data below.
You can remove the information box by simply clicking on the Close button.
5. Drawing and Measuring on the Map;
Interrogating the data.
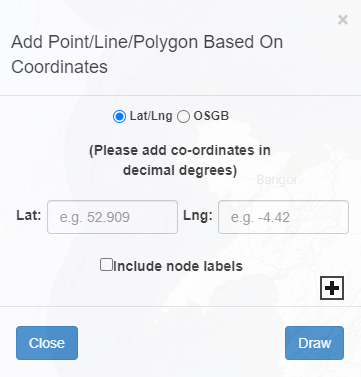
Drawing Points, Lines and Polygons
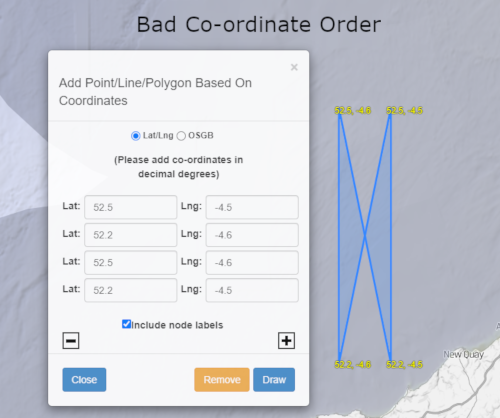
The Add Point/Line/Polygon Based on Co-ordinates tool allows you to draw a shape on the map using either Latitude and Longitude or British National Grid co-ordinates.
- First, choose the co-ordinate system you wish to use, by selecting either OSGB (for British National Grid Eastings and Northings) or Lat/Lng (for Latitude and Longitude)
- National Grid references beginning with a two-letter code will need to be converted to Eastings and Northings, e.g. ST 21227 78273 will become 321227, 178273. More information on converting National Grid references to Eastings and Northings is available here.
- Co-ordinates for a single point can be entered in the boxes provided.
- In order to draw a line or polygon, you will need to click on the plus symbol to add additional pairs of co-ordinates.
- The minus symbol can be used to remove a pair of co-ordinates, if required.
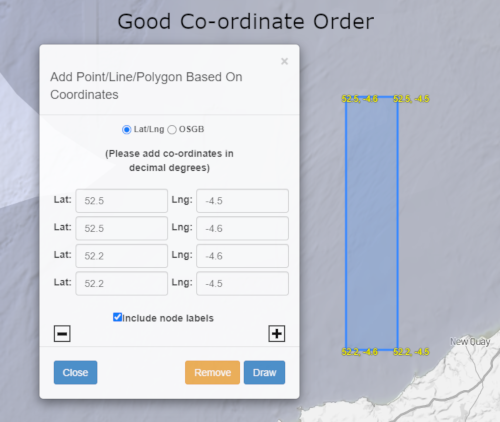
- To add text labels your shape with the co-ordinates for each point, tick Include Node Labels.
- Once all of the co-ordinates have been entered, click on the Draw button to add your shape to the map.
- Click Remove to delete your shape.
- Click Close to exit the tool.
- Care has to be taken to enter the coordinates in a strict order (e.g. clockwise) or unexpected results can occur.
Measuring Areas and Spatial Searches
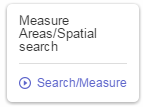
The Measure Areas/Spatial Search tool allows you to measure distance, measure area, or search for policy layers relating to a specific area.
Click on the Search/Measure button to start adding points to the map.

- Click on the map (with the left mouse button) to add your first point. The co-ordinates of your point will appear in the tool.
- After adding a second point, the length of your line will also be displayed within the tool.
- After adding a third point, you will also see the area of your polygon.
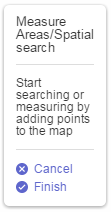
- Continue adding points until you have defined your area of interest.
- Finish drawing the polygon by double-clicking with the left mouse button or by clicking on the Finish button

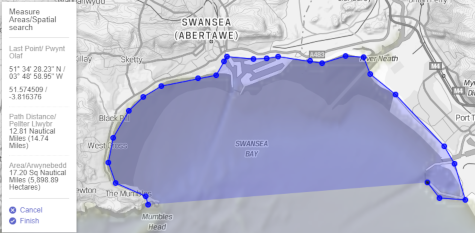
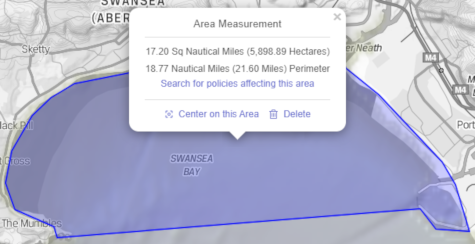
- A summary information box is displayed over your polygon;
- You can then re-centre the map on your area of interest, delete your polygon, or search for policy layers that are related to your area of interest.
- Searching for policy layers may take some time.
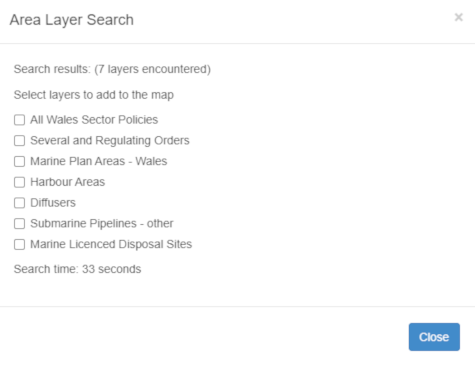
- A Results box will opened once the search is completed, listing the policy layers within the search area.
- Use the tick boxes to select the layers you wish to add to the map, then click Add to Map.
- Your chosen layers will then appear on the map.
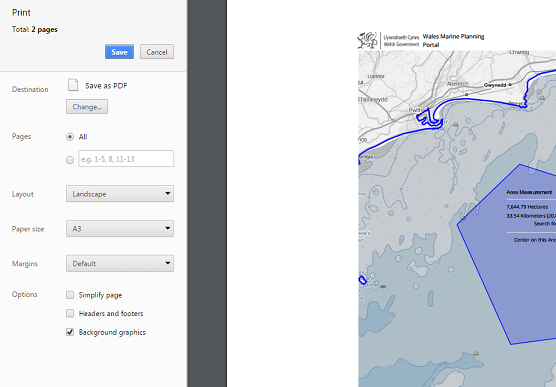
6. Printing
To print the map window, click on the Printer button.

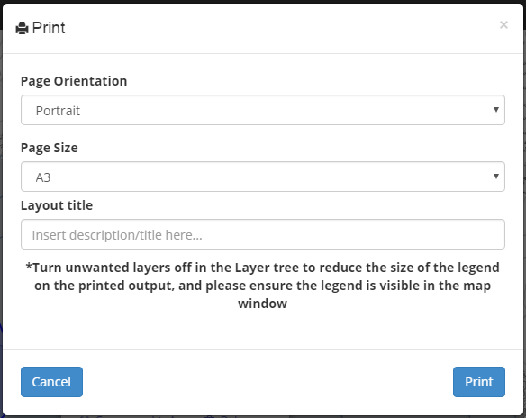
A popup menu with the various print options will open up, allowing you to print in Portrait or Landscape mode;
To choose the paper size (A3/ A4);
And to add in a title for the layout
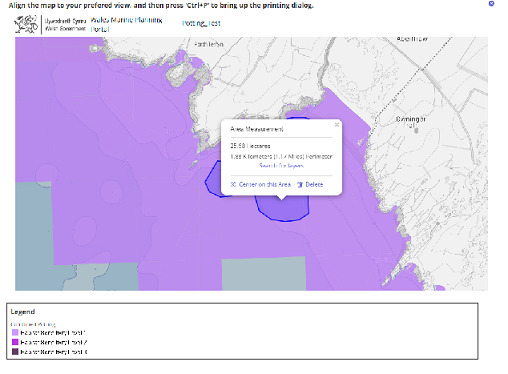
By proceeding with the Print button you will have a window showing the Print Preview of your Map Window
You can 'Pan and Grab' the mapping window to align the map to your prefered view, and zoom in or out.
Then press 'Ctrl+P' to bring up the printing dialogue.
Each Web Browser, be it Internet Explorer, Firefox, Safari etc. handles printing in a different way.
It can be very useful to print the map to a .pdf file, so that it can easily be shared in an email, for example.
Not all Web Browsers support this though, and it may be necessary to install a "plug-in app" or extension to your browser, e.g. Adobe Acrobat.
This screenshot shows an example for the printing in Google Chrome.
Once you have printed/ saved your map window you can return to the main Mapping Page by clicking on the  button in the top Right of the page.
7. Additional Information
Across the top of the page you will find additional information and links to associated marine planning web pages.

Home
This Link will return you to the Portal's Home Page
Cymraeg
This link will take you to the Welsh Language version of the site.